Networks
| ID | Type | Species | Interactions | Connectance | Nestedness | Modularity | Threatened | Reference |
|---|
 Network with more than one component: groups of species that don't interact with each other.
Nestedness, from 0 to 1
Modularity, from 0 to 1
IUCN Red List category
Species in those categories
| ID | Type | Species | Interactions | Connectance | Nestedness | Modularity | Threatened | Reference |
|---|
Network with more than one component: groups of species that don't interact with each other.
Type at least two letters of a species, genus, family or order. Ticking one shows only the networks that contain it.
| Name | Networks |
|---|
www.web-of-life.es is a web service that provides a dataset of ecological interactions.
This web service provides a graphical user interface based on an interactive map for searching and downloading ecological interaction network matrices of several types, their species names, and other useful information such as the reference source, the link to the full paper, the geographic location, etc.
Over the map you can see the markers (circles) where the networks are located. The colour of the markers indicates the type of ecological interaction of the network.
Where several networks share a site, clicking the marker lets you pick one. To keep only the networks of a region, click the square button at the bottom right of the map and drag a box over the region; Clear area brings back all the others.
If you move the mouse pointer over a marker, a popup box will show some basic information about the network.
If you click on the marker, the datasheet of the network will open. There, you will find much more information about the network: unique identifier, number of species, number of interactions, full reference link, location coordinates ... and, of course, the matrix and the name of the species.
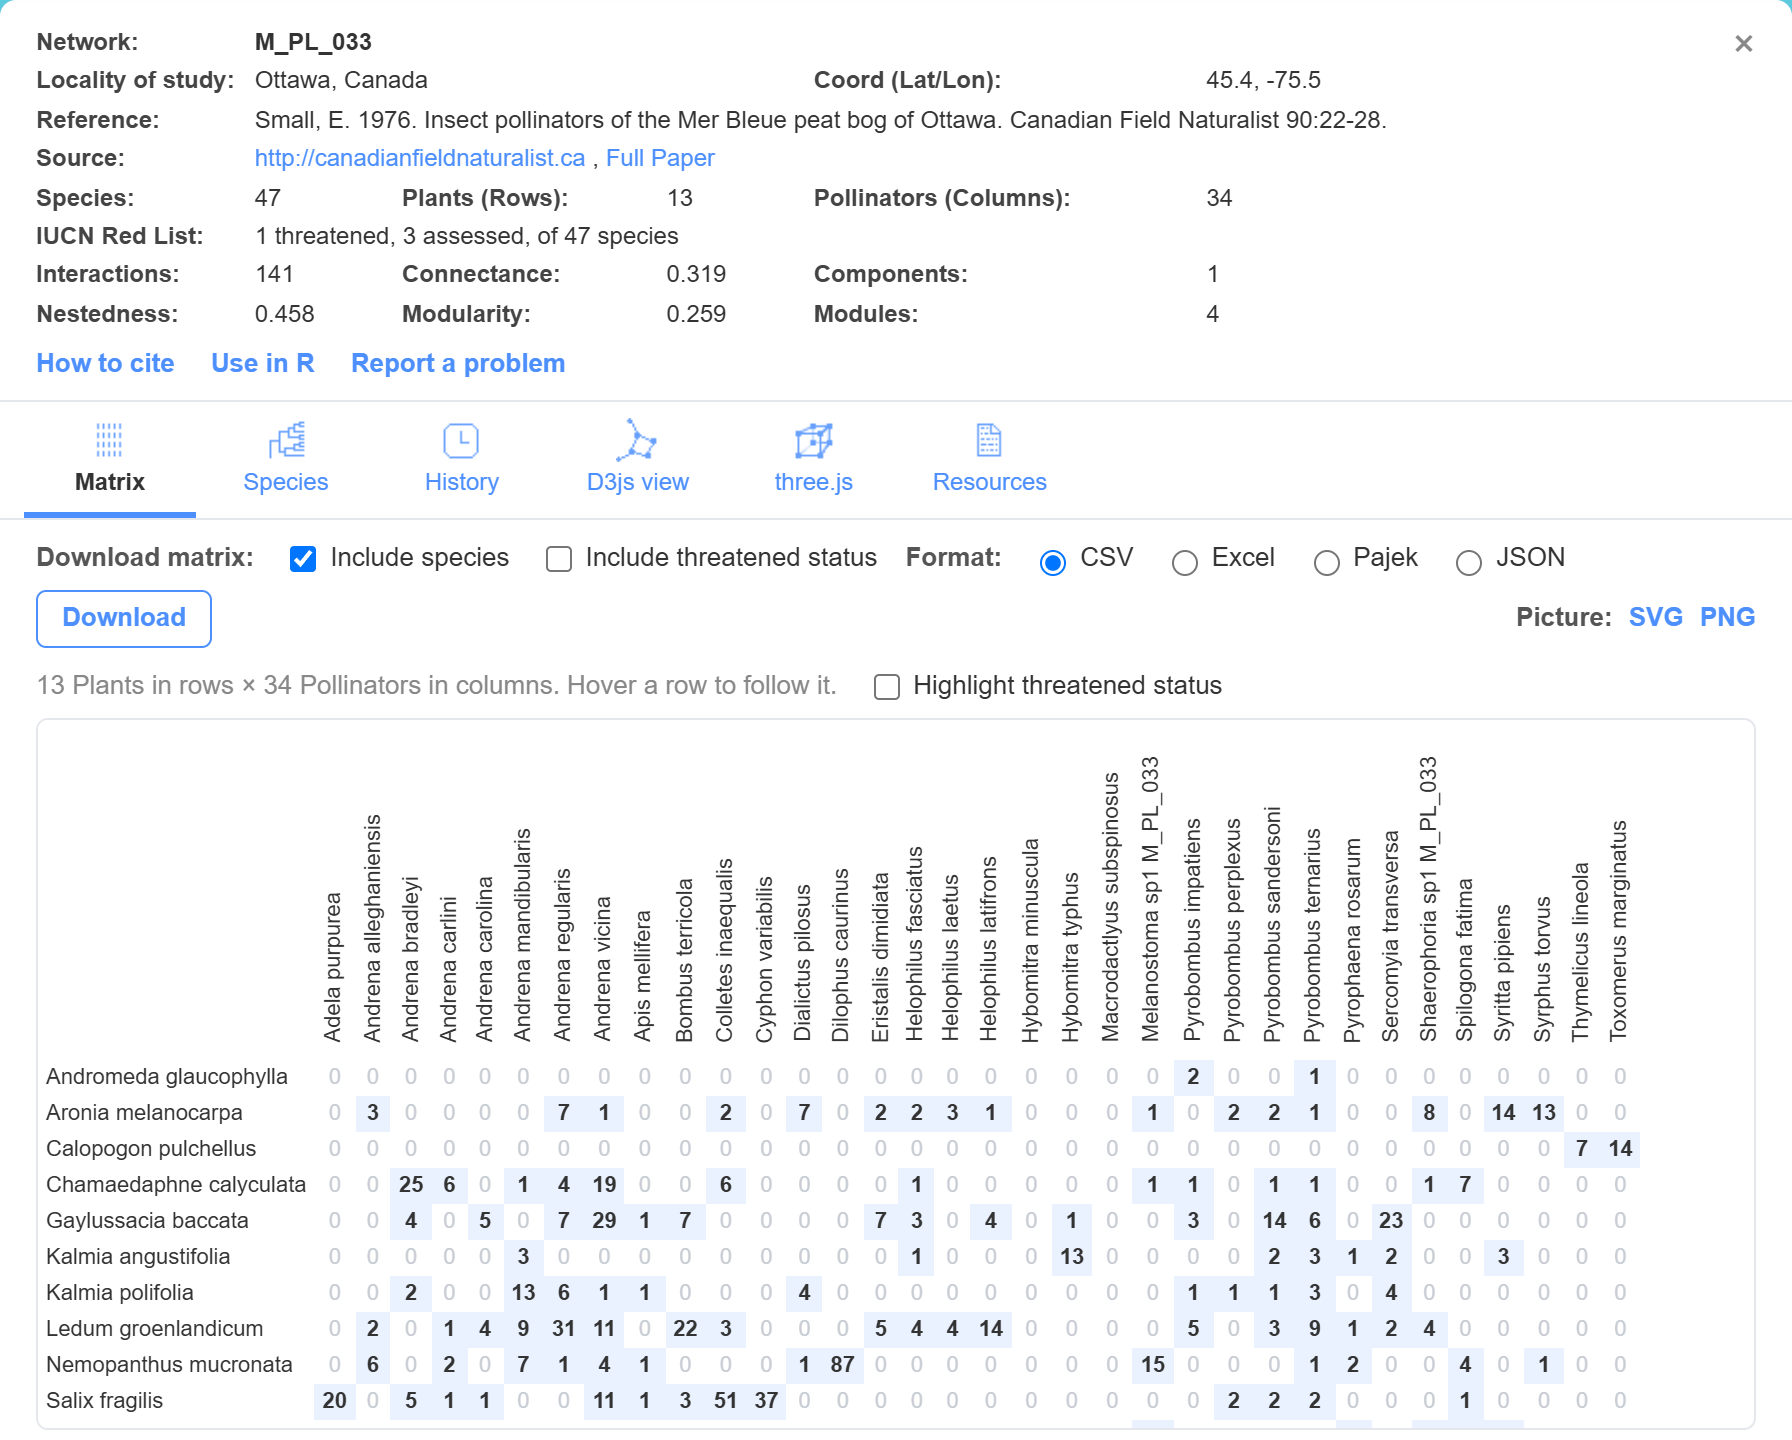
The tab Species shows a list of the species of the network. You can filter, sort, and download it (see the Downloads notes of this section). Click a species name to open it in a window beside the datasheet: its taxonomy, links to GBIF and the Catalogue of Life, and a map and list of all the networks it is in.
You will also find the history records, where all changes are logged, and graphical representations of the network: the D3js view, in a unipartite or a bipartite layout, and three.js, in 3D. Resources lists further material about the network.
Under the header, How to cite gives the text to cite the network and this service (also as BibTeX and RIS files), Use in R gives R code that loads the network, and Report a problem tells us about a mistake in it.
The line IUCN Red List counts the species with a threatened status (categories CR, EN and VU) and those that have been assessed at all. Many species have no assessment, and unidentified species can't have one, so a network with few threatened species may simply have few assessed ones. Highlight threatened status, above the matrix, colours the species by their category.
On top of the map there is a menu bar:

When the web browser loads the map page, it shows the markers of all networks or a subset of them, depending on the link you clicked on the intro page of the site.
This menu bar allows you to filter the results by selecting:
Each time you change some option, the dataset will be filtered, showing over the map only the markers of networks that fit the selection criteria. The address in your browser keeps the filters, so you can bookmark or share a filtered map.
If you want to view a list of networks as a result of the filter applied, click on Results; this will give you more information.
Clicking on Reset will erase the current filter and show the entire list of networks and their markers over the map.
The link Help shows this help page. Use in R explains how to read the data in R, and the Tutorial goes through analysing the networks.
The menu link Download of the menu bar allows you to download the network matrices of the results list. The number between brackets indicates the number of networks in the results list.
The results list shows the list of networks that fit the selection criteria. This list includes basic information about the networks listed: unique identifier (ID), an icon indicating that there is more than one component, type of interactions, number of species, number of interactions, connectance, nestedness, modularity, number of threatened species, and a short reference. This will be useful to find the networks you are searching for.
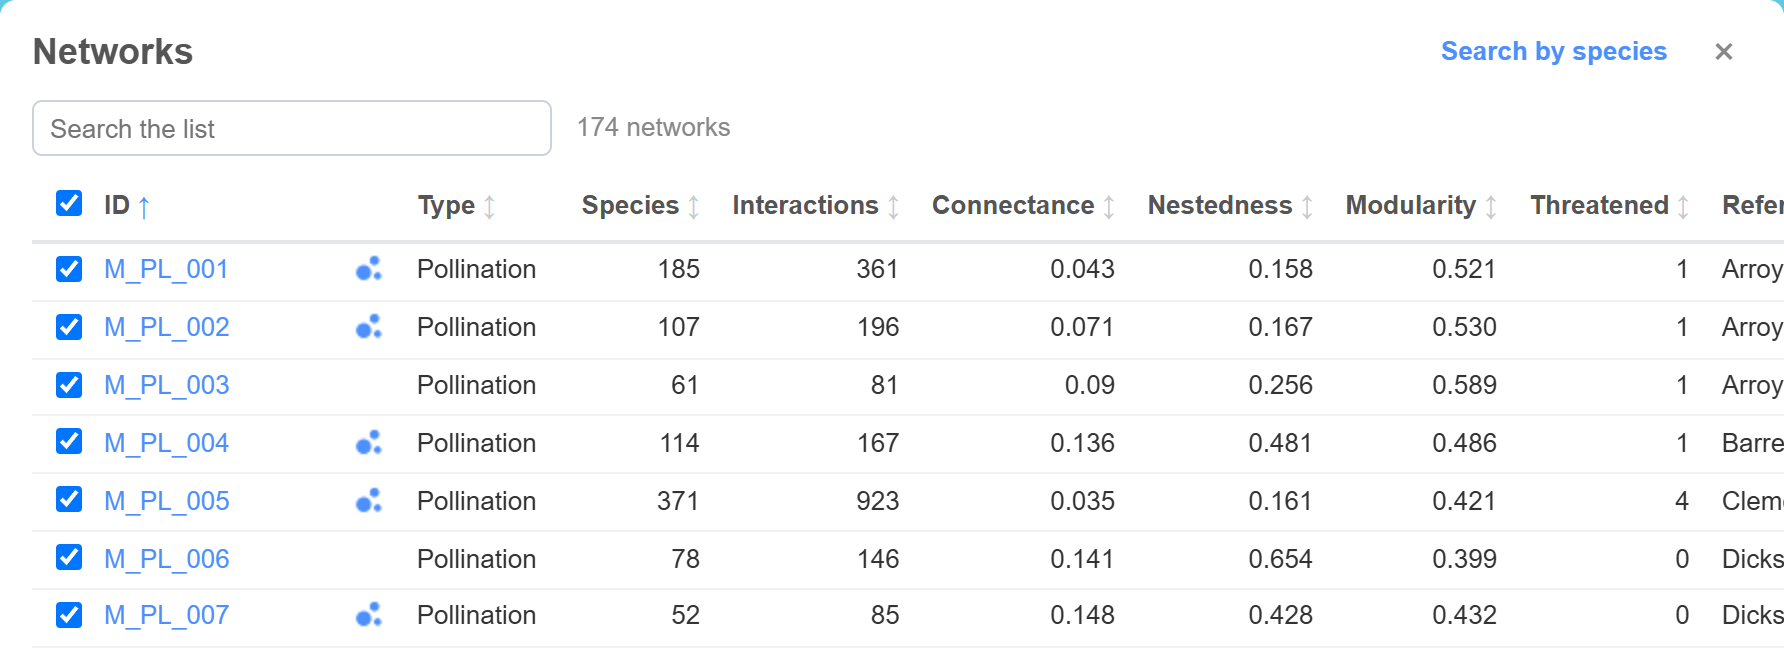
Networks from one study (for example M_PL_060_01 to M_PL_060_24) are grouped together: click the arrow to expand the group. Click a column title to sort the list by that column, and again to reverse the order. Nestedness is computed as in the lab's rweboflife R package (Fortuna et al. 2019); modularity is Barber's bipartite modularity of the matrix of presences and absences.
On top, there is a search box for filtering this list. While writing in it, any row with field values fitting what you write will be shown in the results, and the rest will be hidden. Keep in mind that this does not mean that hidden rows are deleted from the results, they are only hidden. The number between brackets in the Download link will not change.
At the left of each row there is a checkbox. By default, all rows are checked, which means that the network will be included in the zip file for downloading. You can check or uncheck any checkbox to indicate exactly what you want to include in the download zip file. At the header there is a checkbox for checking or unchecking the full list.
In addition to filtering criteria, you can find those networks containing specific species.
By clicking on the link Search by species, which is located on top right of the networks list, a search window opens. Type part of the name of a species, a genus, a family or an order: the matching names are listed with the number of networks they are in.
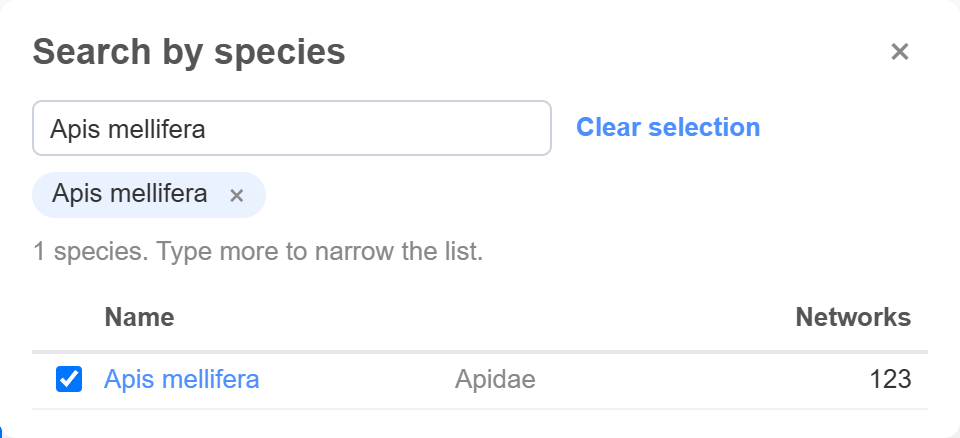
Once you click on the checkbox of any species, the networks list will be filtered: it will only show those networks which fit the selected criteria (type of network, type of data, range of species, range of interactions, …) and contain the selected species. If you tick several, the networks containing any of them are shown.
Note: The panels/windows can be dragged by their title bar for a better view.
Note: if you download a large result set, generating the zip file could take some time. Please, be patient.
You can download networks in three different ways:
The data can be downloaded in these formats:
Individual download format selection:
The options are located on top of the matrix. The list of species is downloaded the same way from the Species tab, and the matrix and the graphs can also be saved as pictures (SVG or PNG).

Zip file download format selection:
The options are located on menu bar → Download (n).
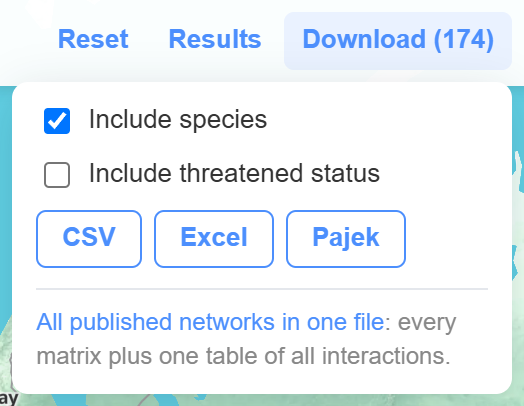
The same menu offers all published networks in one file: every matrix, plus single tables of all networks, all species and all interactions.
When downloading by clicking the download link at the menu bar, a ZIP file will be dynamically generated. It will contain one file per network in the chosen format, the references of downloaded networks, and a readme file. If you tick Include threatened status, it also contains threatened_status.csv, with the IUCN Red List status of each species of each network, or NA if it has none. The history of changes of each network is on its History tab.
The network identifier is composed of three strings concatenated by the underscore character:
A_B_C
The string "A" begins with a capital letter indicating the main group to which the network belongs: M for mutualistic and A for antagonistic networks. Food webs have no group letter.
The string "B" is composed of one or more uppercase letters indicating the type of interaction of the network. Together, "A" and "B" are:
M_AF_FW_A_HP_M_PA_A_PH_M_PL_M_SD_The string "C" is composed of three numerical digits from 0 to 9. Its value can go from 000 to 999. For a given type of interaction, this number is incremented each time a network is added to the database. Networks of one study share the number and get one more string of their own: M_PL_072_01, M_PL_072_02, …
The main purpose of the network identifier is distinguishing any network from each other, using a homogeneous system of reference. Identifiers never change, so you can use them to cite the exact networks you used. Further, we have extended this nomenclature system to non-identified species names, and to species names with taxonomic errors, such as Melanostoma sp1 M_PL_033.
www.web-of-life.es is a service created by Raúl Ortega, Miguel Angel Fortuna, and Jordi Bascompte. It is now maintained by the Bascompte Lab at the University of Zurich, whose research focuses on the structure and dynamics of ecological networks.
This project was initially supported by an ERC Advanced Grant of the European Union. It is now maintained by employees of the University of Zurich, working in the Bascompte Lab.
www.web-of-life.es (Bascompte Lab) is not the author/owner of the data, but the author/owner of the service. The original work by each scientist should be acknowledged.
The data was gathered from scientific studies, in most of the cases, published in scientific journals. We then extracted the data from appendices or repositories associated with those publications or requested the data to the authors. In the cases of unpublished data, it was provided by colleagues or by our own research. We cleaned up data, correcting inconsistencies in species names, grouping rows or columns with repeated species names, etc., and made them easily available to users.
The use of this dataset is free, you can use it in your projects and share it with your collaborators.
If you decide to use this dataset in your projects, you must mention this web service:
"This work has used the Web of Life database (www.web-of-life.es)".
Besides this, we encourage you to cite the authors who collected the data of individual networks: those references are usually provided by us. How to cite, on each network's datasheet, gives both.
If you have network data that you think could be included in the database, please contact us by e-mail. Moreover, we are happy to be informed about potential mistakes you may spot: use Report a problem on the network's datasheet.
Department of Evolutionary Biology and Environmental Studies
University of Zurich
Winterthurerstrasse 190
8057 Zurich
Switzerland
Phone: +41 (0)44 635 47 61
Fax: +41 (0)44 635 57 11
Jordi Bascompte
Every network can be read straight into R with read.csv(); no package is needed. The files are plain CSV in UTF-8, with species names exactly as in the downloads. The examples use network M_PL_006; replace it with any network ID.
# Interaction matrix, species names as row and column names
m <- as.matrix(read.csv("https://www.web-of-life.es/api/v1/networks/M_PL_006/matrix.csv",
                        row.names = 1, check.names = FALSE))

# One row per interaction: network, row_species, column_species, row_role, column_role, strength
edges <- read.csv("https://www.web-of-life.es/api/v1/networks/M_PL_006/edges.csv")

# The species: side of the matrix, role, kingdom, order, family, number of interactions, abundance
species <- read.csv("https://www.web-of-life.es/api/v1/networks/M_PL_006/species.csv")
# One row per network: type, size, connectance, nestedness, modularity, location, reference
networks <- read.csv("https://www.web-of-life.es/api/v1/networks.csv")

# Several networks at once, e.g. all weighted pollination networks
ids <- networks$network[networks$interaction_type == "Pollination" & networks$weighted == 1]
matrices <- lapply(ids, function(id) as.matrix(read.csv(
  paste0("https://www.web-of-life.es/api/v1/networks/", id, "/matrix.csv"), row.names = 1, check.names = FALSE)))
names(matrices) <- ids
Everything at once, with one table of all interactions of all networks: download the zip of all published networks.
| Address | Content |
|---|---|
/api/v1/networks.csv | All networks with their metadata and structure. |
/api/v1/networks/<ID>/matrix.csv | The matrix of one network, without abundances. |
/api/v1/networks/<ID>/edges.csv | Its interactions, one per row. |
/api/v1/networks/<ID>/species.csv | Its species with their role and taxonomy. |
/download/everything/ | A zip with all of the above for every published network. |
The addresses of the previous site keep working with the same output, for the rweboflife package and existing scripts: get_networks.php, get_network_info.php, get_species_info.php, get_networks_by_species.php, get_taxize_info.php and networkjson.php. For example: https://www.web-of-life.es/get_networks.php?network_name=M_PL_006.
Nestedness is computed as in rweboflife::nestedness (Fortuna et al. 2019, Evolution 73: 1001–1011), from 0 to 1. Modularity is Barber's bipartite modularity (Physical Review E 76: 066102, 2007) of the binary matrix, maximised by repeated searches; the number of modules is that of the best partition found.
Please cite the original study of each network and mention the database: "This work has used the Web of Life database (www.web-of-life.es)". Each network's sheet has a How to cite button with BibTeX and RIS files.